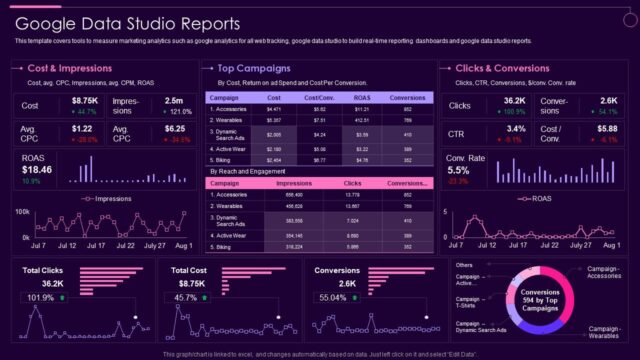
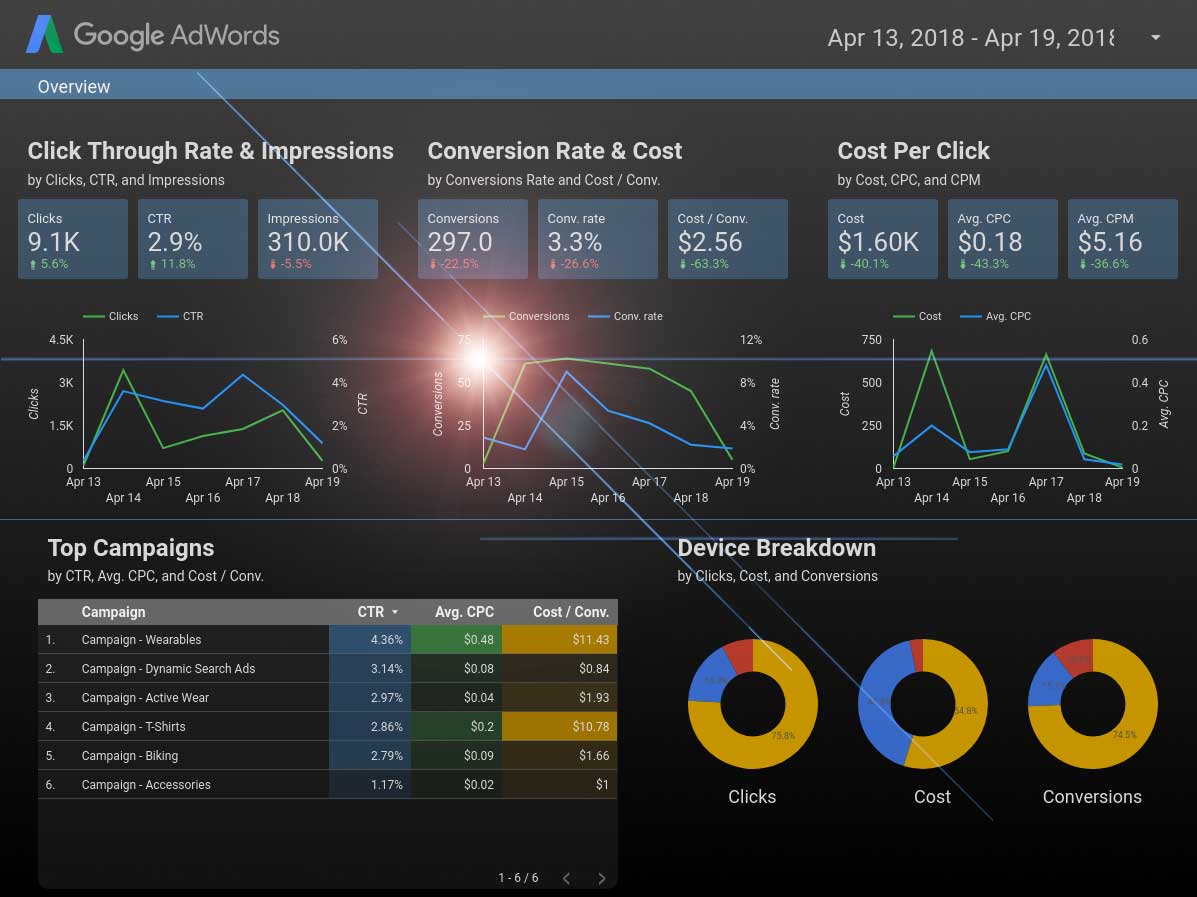
In the world of digital marketing, data is invaluable. Businesses need to analyze their online performance to make informed decisions, and Google Data Studio provides a powerful tool to visualize that data in a way that is easy to understand and share. If you want to enhance your website reporting, here’s a step-by-step guide on how to use Google Data Studio effectively.

Table of Contents
Toggle1. Getting Started with Google Data Studio
Google Data Studio is a free reporting and dashboard tool that transforms your data into informative, easy-to-read reports. To start using Google Data Studio, you’ll need a Google account. Simply navigate to Google Data Studio and sign in. Once you’re logged in, you can create a new report by clicking on the “+” button.
2. Connect Your Data Sources
Google Data Studio allows you to connect to various data sources. The most common sources for website reporting include:
- Google Analytics: Offers insights into website traffic, user behavior, and conversion metrics.
- Google Ads: Provides information about paid advertising performance.
- Google Search Console: Displays data on search visibility and keyword performance.
- CSV Files: You can also upload data in CSV format for custom reporting.
To connect a data source, click on “Create New Data Source” and select your desired option. Follow the prompts to authenticate and grant permissions.
3. Building Your Report
Once you have connected your data sources, it’s time to build your report. Google Data Studio offers a drag-and-drop interface, making it user-friendly even for those with limited technical skills. Here’s how to structure your report:
- Add Charts and Graphs: Click on the “Add a Chart” option to include various visualization types such as bar charts, line graphs, tables, and pie charts. Choose the type that best represents the data you want to showcase.
- Customize Data: Select the data you want to visualize from your connected data source. You can apply filters, metrics, and dimensions to display the most relevant information.
- Use Filters and Date Ranges: Enhance your report by adding filters that allow viewers to narrow down the data by dimensions like date range, traffic source, or user location.
4. Designing Your Report
Visual appeal is crucial for effective reporting. Here are some design tips to make your Google Data Studio report more engaging:
- Use Themes: Apply a consistent theme to your report to ensure a cohesive look. You can choose from pre-set themes or create a custom color palette.
- Include Branding: Add your company logo and use brand colors to enhance brand recognition.
- Organize with Layouts: Utilize grids and layout options to organize charts and tables neatly. Proper alignment and spacing can significantly improve readability.
5. Adding Interactivity
Interactivity can make your reports more engaging. Google Data Studio allows you to add interactive elements, such as:
- Date Range Controls: Enable viewers to select custom date ranges for data analysis.
- Filter Controls: Allow users to filter data by dimensions like country, device, or traffic source.
- Drill-Down Capabilities: Set up drill-down options that let users click on data points for more detailed insights.
These interactive features can help stakeholders explore the data and gain deeper insights into performance.
6. Sharing Your Report
Once you’ve created your report, it’s time to share it with your team or stakeholders. Google Data Studio makes sharing easy:
- Collaborative Editing: Invite team members to collaborate on the report by clicking the “Share” button and entering their email addresses. You can set permissions for viewing or editing.
- Public Sharing: If you want to share the report with a broader audience, you can publish it publicly. Just be cautious about sharing sensitive data.
- Scheduled Email Delivery: Set up automatic email delivery for your report to send updates to stakeholders regularly. You can customize the frequency and recipients.
7. Regularly Updating Your Report
One of the significant advantages of Google Data Studio is that it pulls live data from your sources. This means your reports will always display the most up-to-date information. However, consider reviewing and updating your reports periodically to ensure they remain relevant. Add new metrics, remove outdated data, or redesign sections to keep the report fresh and engaging.
8. Analyzing and Making Data-Driven Decisions
With your Google Data Studio report set up, it’s time to analyze the data. Look for trends, patterns, and anomalies that can inform your marketing strategies. Use insights from your website reporting to make data-driven decisions, such as optimizing your content, refining your SEO strategies, or adjusting your advertising budget.
Conclusion
Google Data Studio is an invaluable tool for website reporting, allowing you to visualize and analyze data effectively. By connecting data sources, building interactive reports, and sharing insights with your team, you can enhance your digital marketing efforts and drive better results. Start leveraging Google Data Studio today to turn your data into actionable insights that propel your business forward!


No responses yet