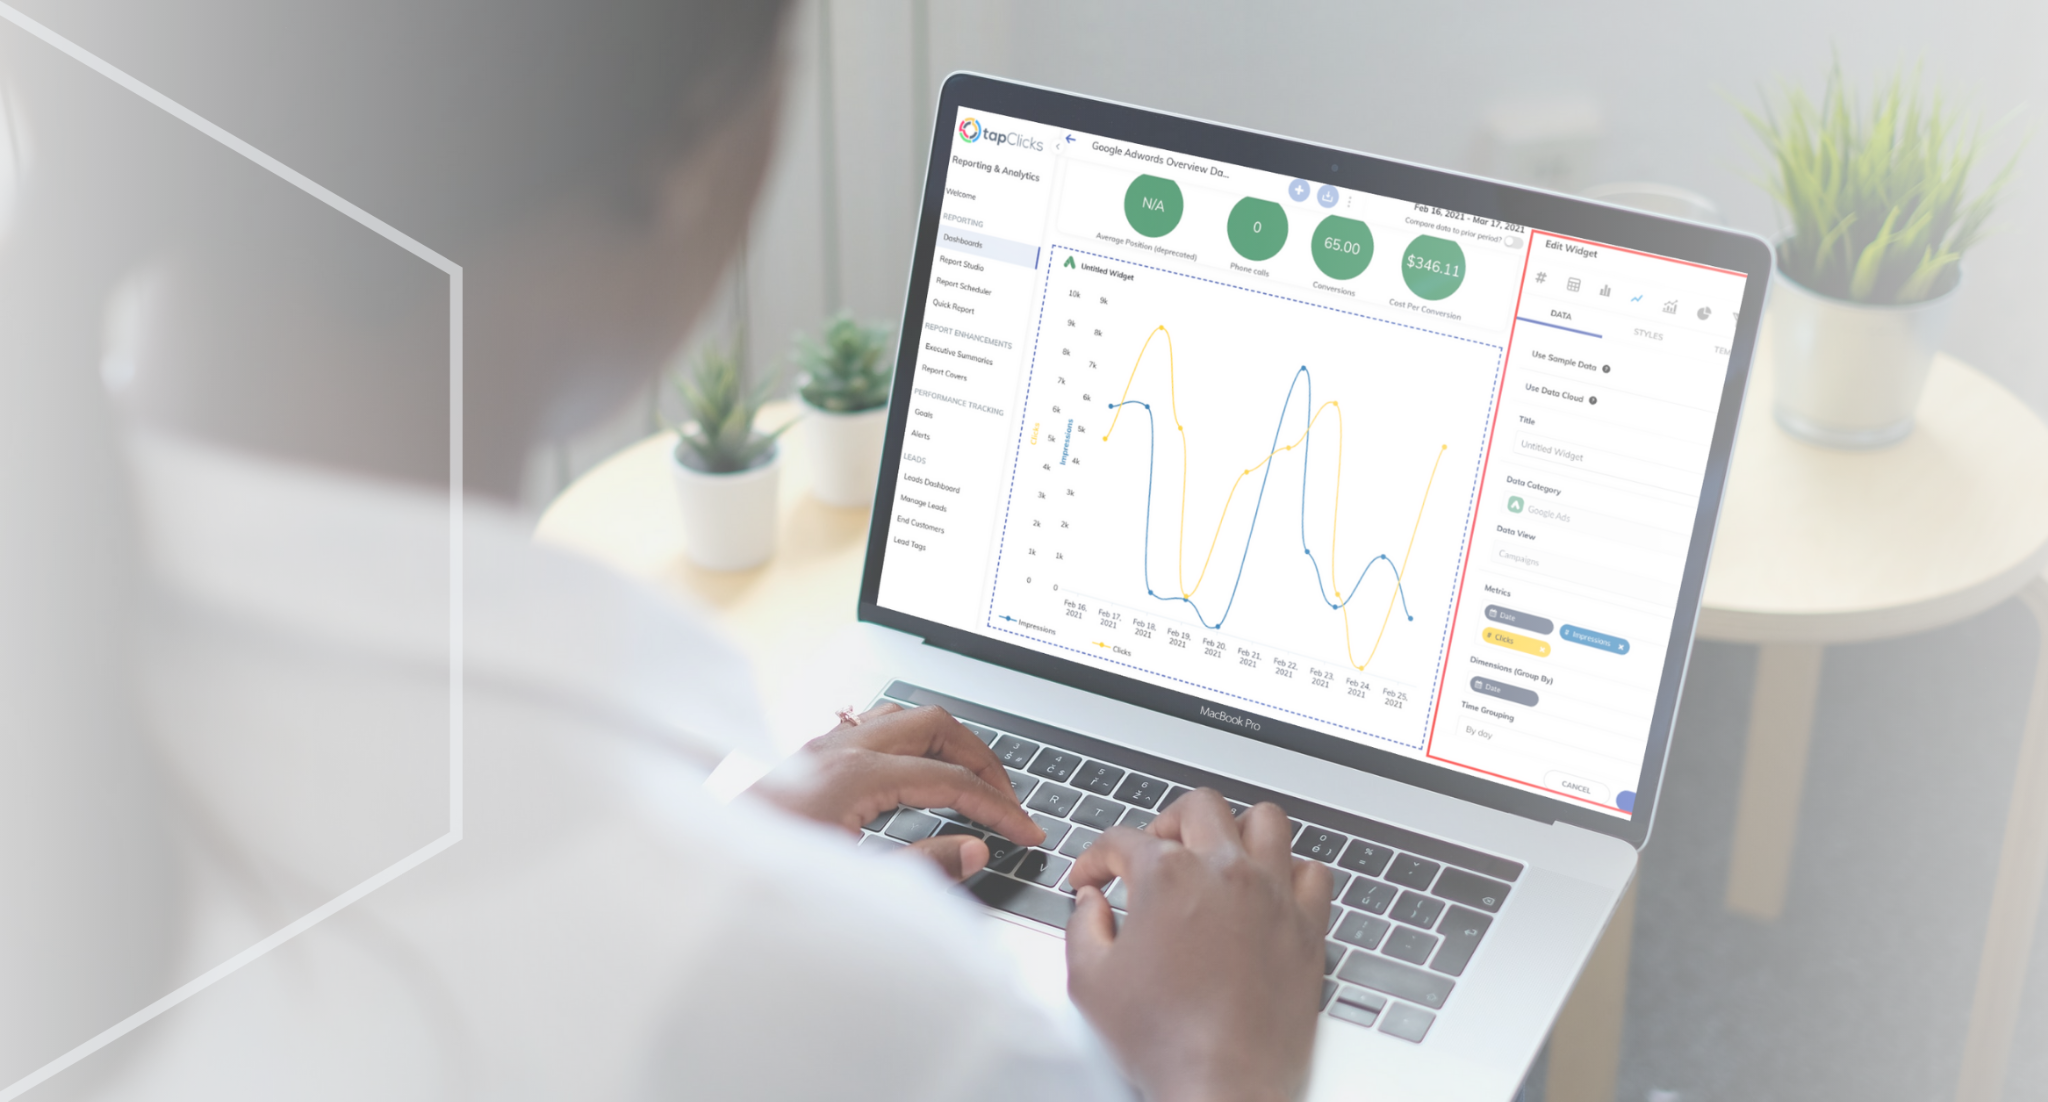
In the fast-paced world of digital marketing, the ability to monitor and analyze performance metrics is crucial for success. Dashboards have emerged as powerful tools that help marketers visualize data, track performance, and make informed decisions. In this blog, we’ll explore how to use dashboards effectively to track marketing performance, the benefits they offer, and the key metrics you should consider monitoring.

Table of Contents
ToggleWhat is a Marketing Dashboard?
A marketing dashboard is a visual representation of key performance indicators (KPIs) and metrics that provide insights into the effectiveness of marketing campaigns and strategies. Dashboards aggregate data from various sources, presenting it in a clear, concise format that allows marketers to quickly assess performance and make data-driven decisions.
Types of Marketing Dashboards
- Operational Dashboards: These track day-to-day marketing activities, such as campaign performance, website traffic, and lead generation.
- Strategic Dashboards: These focus on long-term goals and objectives, providing insights into overall marketing performance and alignment with business goals.
- Analytical Dashboards: These are designed for in-depth analysis, enabling marketers to explore data trends, conduct what-if scenarios, and uncover insights.
Benefits of Using Dashboards for Marketing Performance Tracking
1. Real-Time Insights
Dashboards provide real-time data updates, allowing marketers to monitor performance as it happens. This immediacy helps identify issues quickly and enables timely adjustments to campaigns.
2. Data Visualization
Visual representations of data, such as graphs, charts, and gauges, make it easier to understand complex information at a glance. Dashboards can highlight trends, patterns, and anomalies, facilitating better decision-making.
3. Centralized Data Access
Dashboards consolidate data from multiple sources—such as social media, web analytics, and email marketing platforms—into a single view. This centralization eliminates the need to switch between various tools and saves time.
4. Enhanced Collaboration
Marketing teams can use dashboards to share insights and reports with stakeholders easily. Dashboards promote transparency and foster collaboration, ensuring everyone is aligned on performance goals.
5. Goal Tracking
Dashboards allow marketers to set and track goals effectively. By visualizing progress toward objectives, teams can stay motivated and focused on key initiatives.
Key Metrics to Include in Your Marketing Dashboard
1. Website Traffic
Tracking website traffic provides insights into how many visitors are engaging with your content. Metrics to consider include:
- Total Visitors: The number of unique visitors to your site.
- Traffic Sources: Break down traffic by source (organic, direct, referral, social) to understand where your audience is coming from.
2. Conversion Rates
Measuring conversion rates helps assess the effectiveness of your marketing campaigns. Consider tracking:
- Overall Conversion Rate: The percentage of visitors who complete a desired action (e.g., making a purchase or filling out a form).
- Lead Conversion Rate: The percentage of leads that become customers.
3. Customer Acquisition Cost (CAC)
CAC measures the cost of acquiring a new customer. It’s calculated by dividing total marketing expenses by the number of new customers gained during a specific period. Monitoring CAC helps assess the efficiency of your marketing efforts.
4. Return on Investment (ROI)
ROI is a critical metric for evaluating the effectiveness of marketing campaigns. It’s calculated as:
ROI=Net ProfitTotal Investment×100\text{ROI} = \frac{\text{Net Profit}}{\text{Total Investment}} \times 100ROI=Total InvestmentNet Profit×100A positive ROI indicates that your marketing efforts are generating more revenue than they cost.
5. Engagement Metrics
Engagement metrics help assess how well your audience interacts with your content. Key metrics to track include:
- Social Media Engagement: Likes, shares, comments, and overall reach on social platforms.
- Email Open and Click-Through Rates: The percentage of recipients who open your emails and click on links within them.
6. Customer Lifetime Value (CLV)
CLV measures the total revenue a customer is expected to generate over their lifetime. Understanding CLV helps you allocate resources effectively and focus on retaining high-value customers.
7. Lead Generation Metrics
Track metrics related to lead generation, such as:
- Number of Leads: The total number of leads generated through various channels.
- Lead Quality Score: A score assessing the likelihood of a lead converting into a paying customer.
How to Build an Effective Marketing Dashboard
1. Define Your Goals
Before creating a dashboard, establish your marketing goals. Determine what metrics align with these goals and what insights will help you achieve them.
2. Choose the Right Tools
Select a dashboard tool that fits your needs. Popular options include:
- Google Data Studio: A free tool that allows you to create customizable dashboards using data from various sources.
- Tableau: A powerful data visualization tool for creating interactive dashboards.
- HubSpot: Offers marketing dashboards as part of its CRM platform.
3. Integrate Data Sources
Connect your dashboard to the various data sources you use, such as Google Analytics, social media platforms, email marketing tools, and CRM systems. Ensure data flows seamlessly into the dashboard for real-time updates.
4. Design for Clarity
Focus on creating a clean, intuitive design that prioritizes clarity. Use visualizations that effectively communicate data trends and insights. Limit the number of metrics displayed to avoid overwhelming users.
5. Regularly Review and Update
Set a schedule for reviewing your dashboard’s performance metrics. Regularly update your goals and metrics to reflect changing business needs and marketing strategies.
Conclusion
Using dashboards to track marketing performance is a game-changer for businesses looking to make data-driven decisions. By providing real-time insights, visualizing complex data, and centralizing information from multiple sources, dashboards empower marketers to optimize their strategies and drive better results. By tracking key metrics and continuously refining your approach, you can enhance your marketing effectiveness and achieve your business goals. Embrace the power of dashboards, and let data guide your marketing journey.


No responses yet