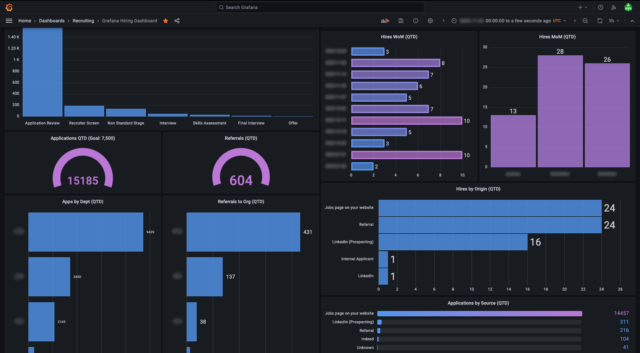
Building a custom dashboard for your website and mobile apps can enhance user experience by providing valuable insights and tools tailored to the needs of your users. A well-designed dashboard can display key metrics, visualizations, and functionalities in a user-friendly manner. Here’s a step-by-step guide to creating a custom dashboard:

Table of Contents
ToggleStep 1: Define the Purpose and Audience
- Identify User Needs: Understand who your users are (e.g., administrators, managers, customers) and what information they need from the dashboard.
- Determine Key Metrics: Decide on the key performance indicators (KPIs) and data points that should be displayed. This could include metrics like sales figures, user activity, project statuses, or system health.
Step 2: Plan the Layout and Design
- Sketch Wireframes: Create wireframes to visualize the layout of the dashboard. Focus on the arrangement of elements like charts, tables, and filters.
- User-Centric Design: Ensure the design is intuitive and user-friendly. Use familiar UI patterns and visual hierarchies to guide users to important information.
- Responsive Design: Design the dashboard to be responsive so that it works well on different screen sizes, including desktops and mobile devices.
Step 3: Choose the Technology Stack
- Frontend Development:
- Use HTML, CSS, and JavaScript frameworks such as React, Angular, or Vue.js for the frontend development of the dashboard.
- Consider using a UI component library like Material-UI or Bootstrap to speed up development and ensure a polished look.
- Backend Development:
- Choose a backend technology such as Node.js, Python (Flask/Django), Ruby on Rails, or PHP to handle data processing and API management.
- Set up a database (e.g., MySQL, PostgreSQL, MongoDB) to store and retrieve the necessary data.
Step 4: Develop the Dashboard
- Set Up the Development Environment: Install necessary tools, libraries, and frameworks for both frontend and backend development.
- Build the API:
- Create RESTful or GraphQL APIs to fetch data from your backend and serve it to the dashboard.
- Implement authentication and authorization to ensure that only authorized users can access the dashboard.
- Implement Data Visualization:
- Use charting libraries like Chart.js, D3.js, or Highcharts to create visual representations of your data (e.g., line charts, bar graphs, pie charts).
- Ensure visualizations are clear and provide meaningful insights to users.
- Add Interactivity:
- Implement features like filters, sorting, and search functionalities to allow users to customize the data they view.
- Use AJAX or WebSockets for real-time updates if your dashboard requires live data.
Step 5: Testing and Quality Assurance
- Conduct Testing:
- Perform unit testing and integration testing to ensure that individual components and the overall dashboard function correctly.
- Test responsiveness and performance on various devices and browsers to ensure a consistent user experience.
- Gather Feedback:
- Involve potential users in testing and gather feedback to identify areas for improvement.
- Make necessary adjustments based on user feedback to enhance usability and functionality.
Step 6: Deployment and Maintenance
- Deploy the Dashboard:
- Choose a hosting provider (e.g., AWS, Heroku, DigitalOcean) to deploy your backend and frontend applications.
- Ensure that your API endpoints are secured, and data is encrypted in transit.
- Monitor Performance:
- Implement monitoring tools to track the performance and usage of the dashboard.
- Use analytics to gather insights into user interactions and identify areas for optimization.
- Regular Updates:
- Continuously improve the dashboard by adding new features, updating visualizations, and addressing user feedback.
- Ensure that security patches and software updates are applied regularly.
Conclusion
Building a custom dashboard for your website and mobile apps can significantly enhance user experience by providing meaningful insights and tools tailored to their needs. By following these steps—defining user needs, designing a user-friendly layout, choosing the right technology stack, developing the dashboard, and conducting thorough testing—you can create a powerful dashboard that adds value to your users and your business. Continuous improvement and user feedback will help ensure the dashboard remains relevant and effective over time.


No responses yet